A machine learning model for the prediction of reactionary delay

Author: Paolino De Falco (UoW)
Dispatcher3 aims at identifying and analysing the differences between planned and executed flights providing a support for fleet management decisions. One of the main actors involved in the fleet management is the duty manager whose main responsibility is to assess the impact of delays and disruptions preventing their propagation through the network considering actions such as aircraft swapping, crew reassignment or waiting for connecting passengers. The duty manager therefore needs a look-ahead time of several hours and Dispatcher3 will support their actions by identifying flights in the network that might suffer from disruptions.
Typically, airlines allocate a specific amount of time for flight and ground operations with some temporal buffers. These buffers are allocated to absorb disruptions as the airline operations suffer from uncertainties linked to external factors such as the weather conditions or congestion.
At planning stage, the duration of the buffer and of the flight operations are pre-allocated to make sure that typical delays can be absorbed (lower part of Figure 1). In reality, some of the flights or ground operations might require more time than expected. In these situations, buffers can only partially absorb the delay which is, therefore, propagated to the following flight forcing it to depart with a certain delay. Indeed, you can notice that the flight 3 (F3) in the upper part of Figure 1 is shifted with respect to the allocated one (lower part of the figure) indicating a propagation of delay due to the duration of flight 2 (F2) and the ground time prior flight 3. Departure delay often translate into arrival delay and, therefore into cost. Identifying in advance which flights might suffer from propagated delay is crucial and might allow airlines to improve their planning and to reduce management costs. Finally, note how even delay early in the morning could in some instances propagate through the day up to the point of infringing a costly curfew in the evening. Identifying this as early as possible to apply corrective measures is crucial!
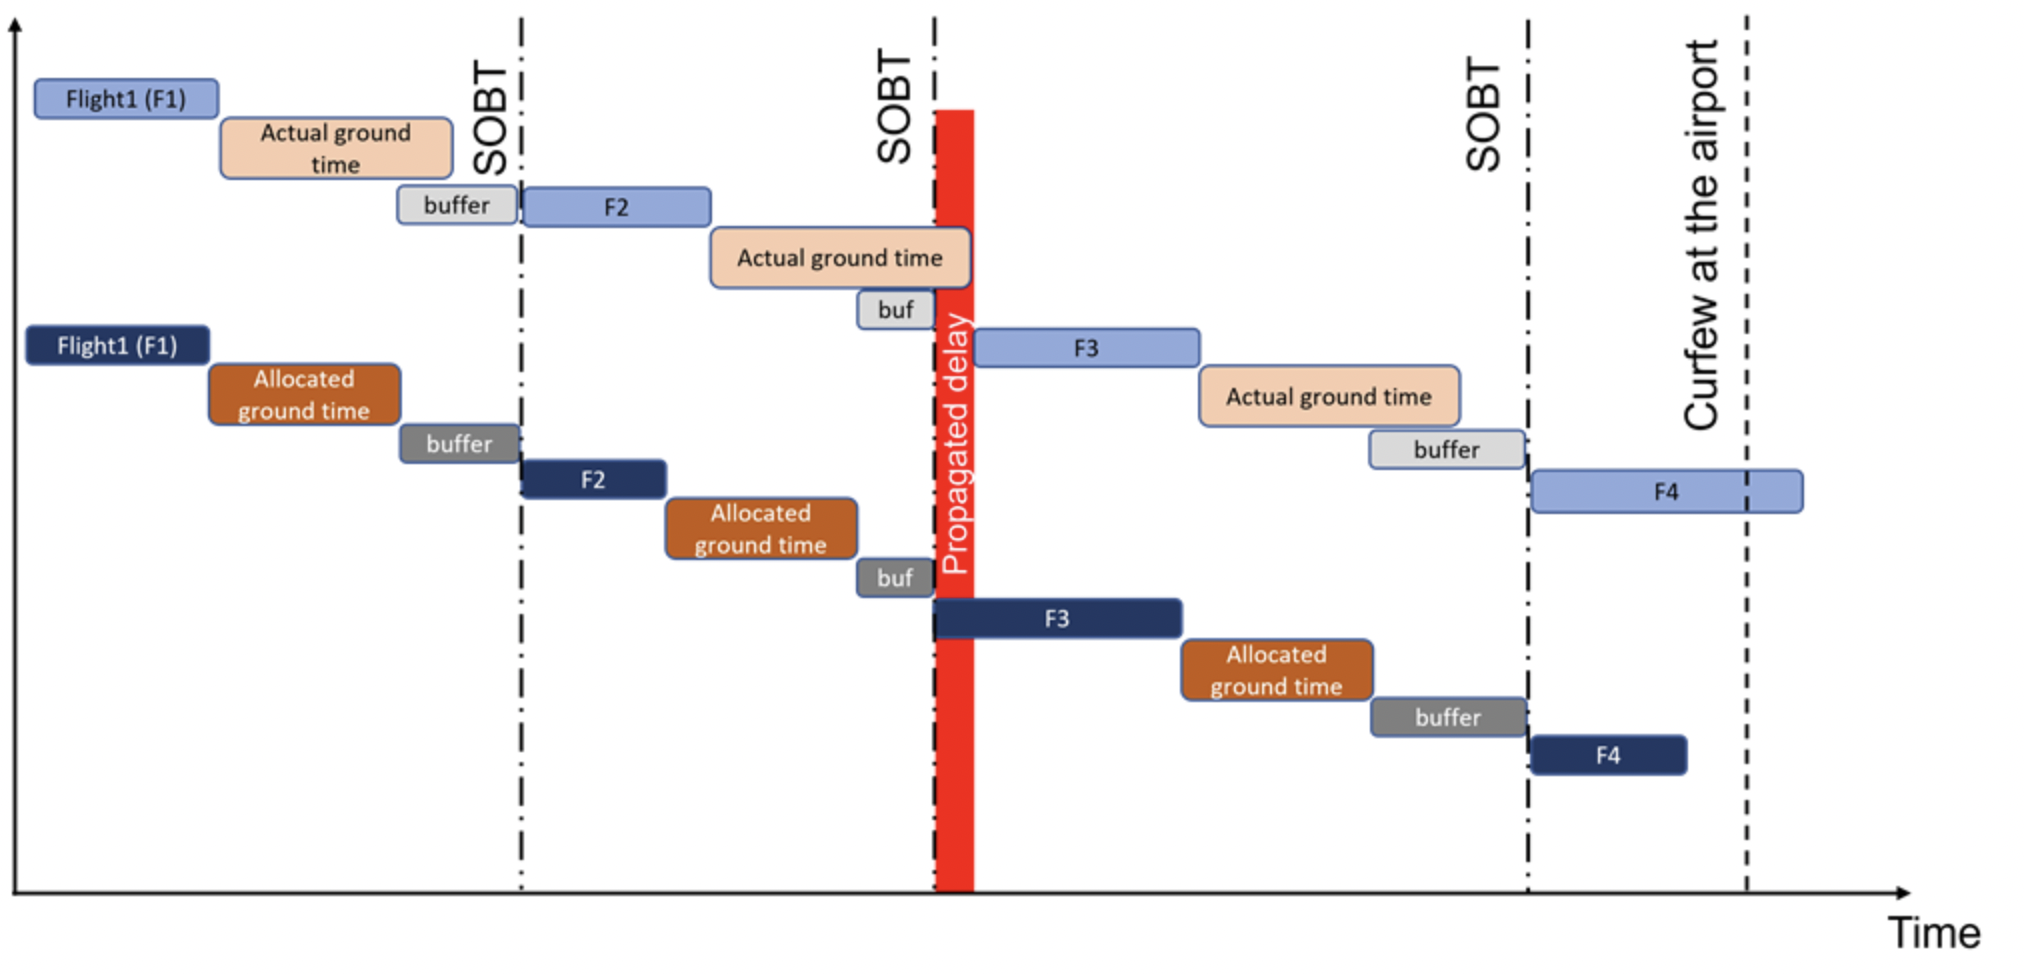
Figure 1: Planned (allocated) vs actual ground and flight times. The propagation of delay starts as soon as the accumulated delay cannot be absorbed by the buffers. This is the case for the flight 3 (F3) in the upper part of the figure.
In Dispatcher3 a Machine Learning (ML) based model has been built to predict flight and ground time durations using a set of historical weather and traffic data. As airplanes operate in a highly uncertain and unstable environment most of the information and outcomes of the models are provided as probabilistic distributions. Instead of relaying on simulations of the propagation of the delay (e.g. a Monte Carlo simulation), Dispatcher3 uses machine learning models which directly provide the distribution of the predicted process (flight or ground).
An example of the predictions generated by the model is shown in Figure 2.
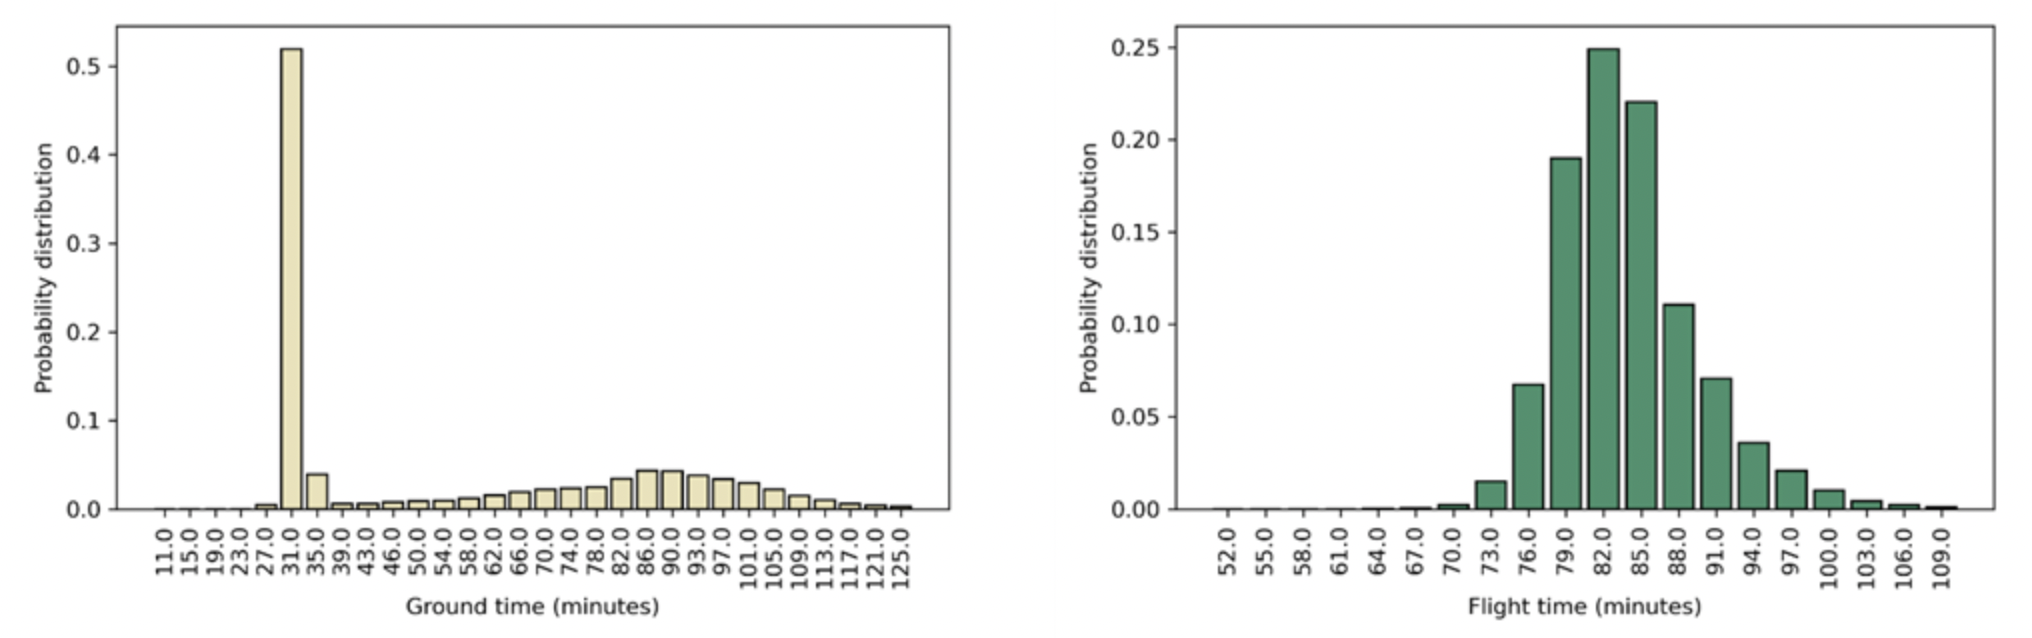
Figure 2: An example of predicted time distributions for ground and flight operations of a flight Amsterdam – Munich operated in September 2018.
By combining the distributions of ground and flight durations for the flights in the network and by comparing the time distribution of these event with the scheduled in and off block time, the model can predict the probability of a flight to depart or arrive with a certain of amount of delay as a function of the delay of the first flight in the network (as shown in Figure 3).
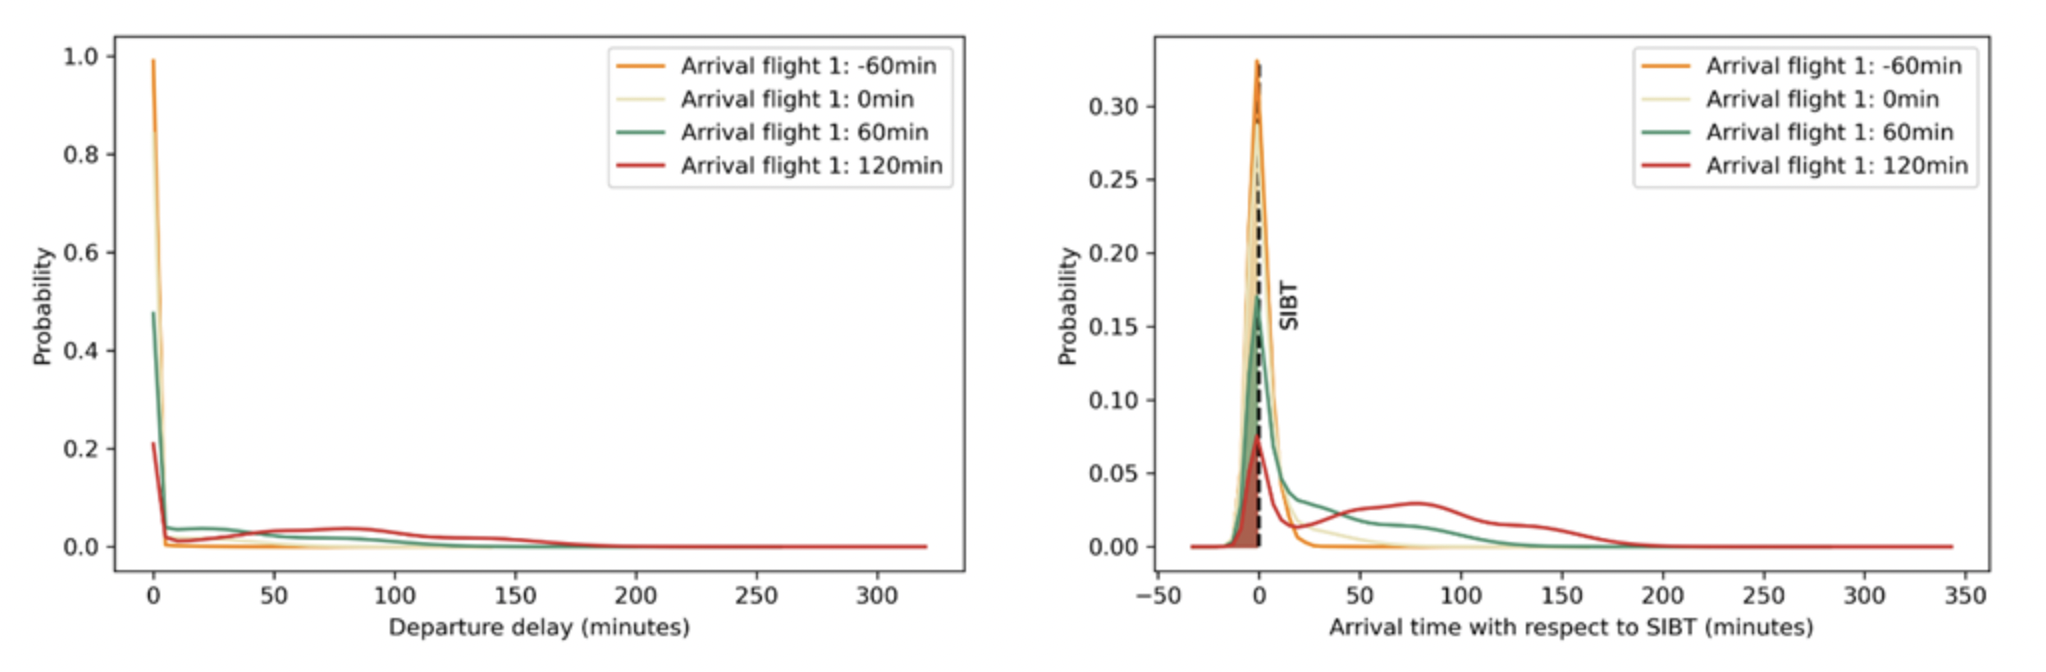
Figure 3: Departure delay (with the respect to the schedule off-block time) and arrival delay (with respect to the schedule in-block time) of a flight Amsterdam – Munich operated in September 2018 as a function of the arrival delay of the first flight in the network.
As function of departure delay, the distributions of the propagated reactionary delay and associated costs are estimated (Figure 4).
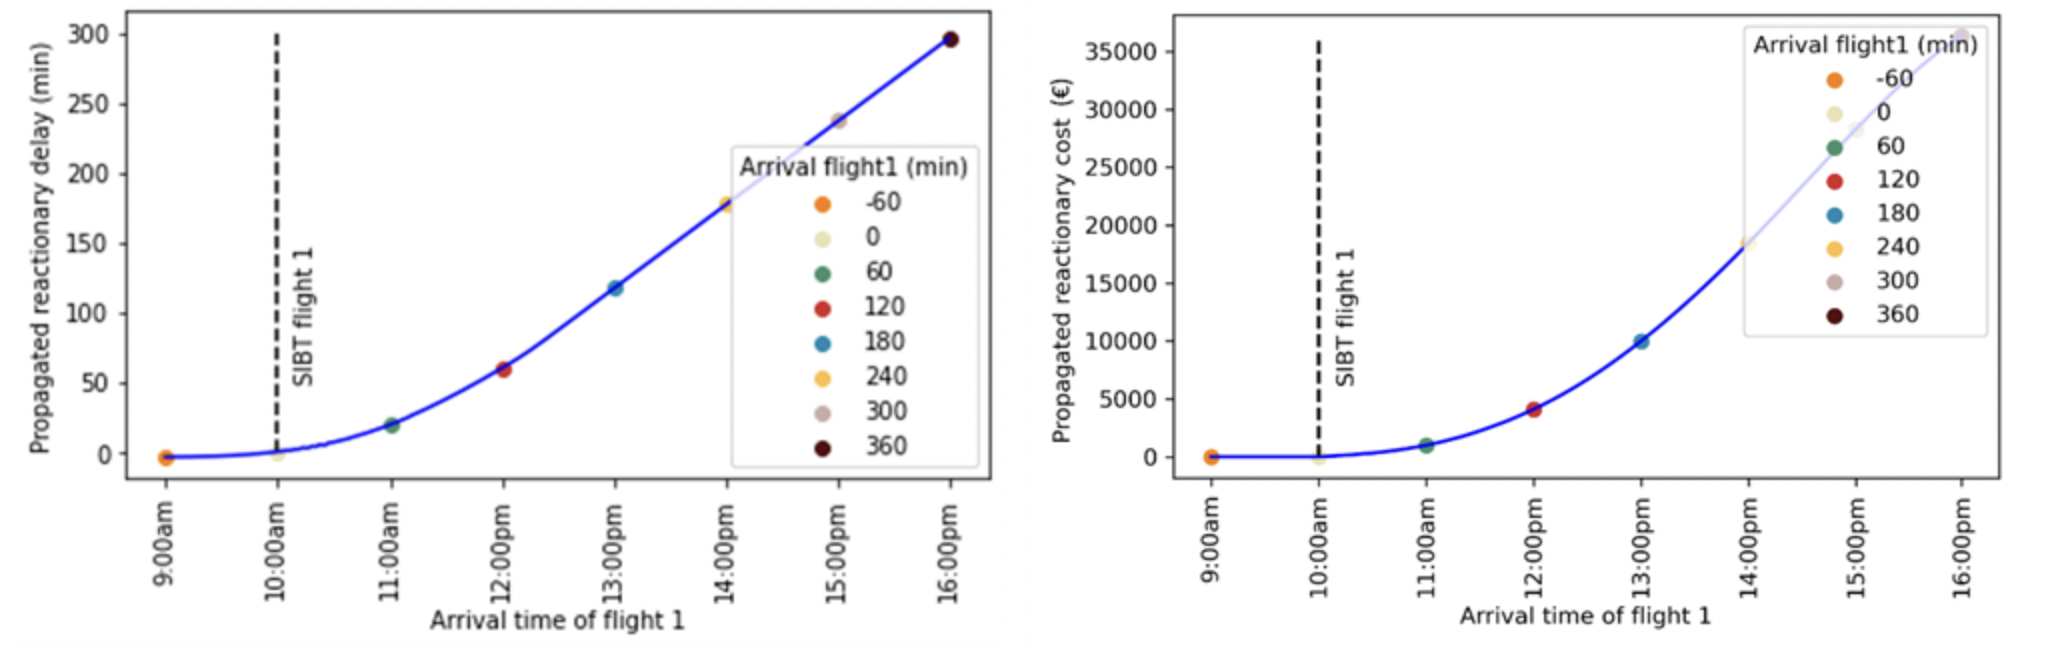
Figure 4: Propagated reactionary delay and costs associated with a flight Amsterdam – Munich operated in September 2018 as a function of the arrival delay of the first flight in the network.
The model can also be used to estimate the probability of infringing the curfew at an airport as function of the departure delay of a certain flight (Figure 5) indicating in a simple manner to the duty manager the most critical sequence of flights for the day.
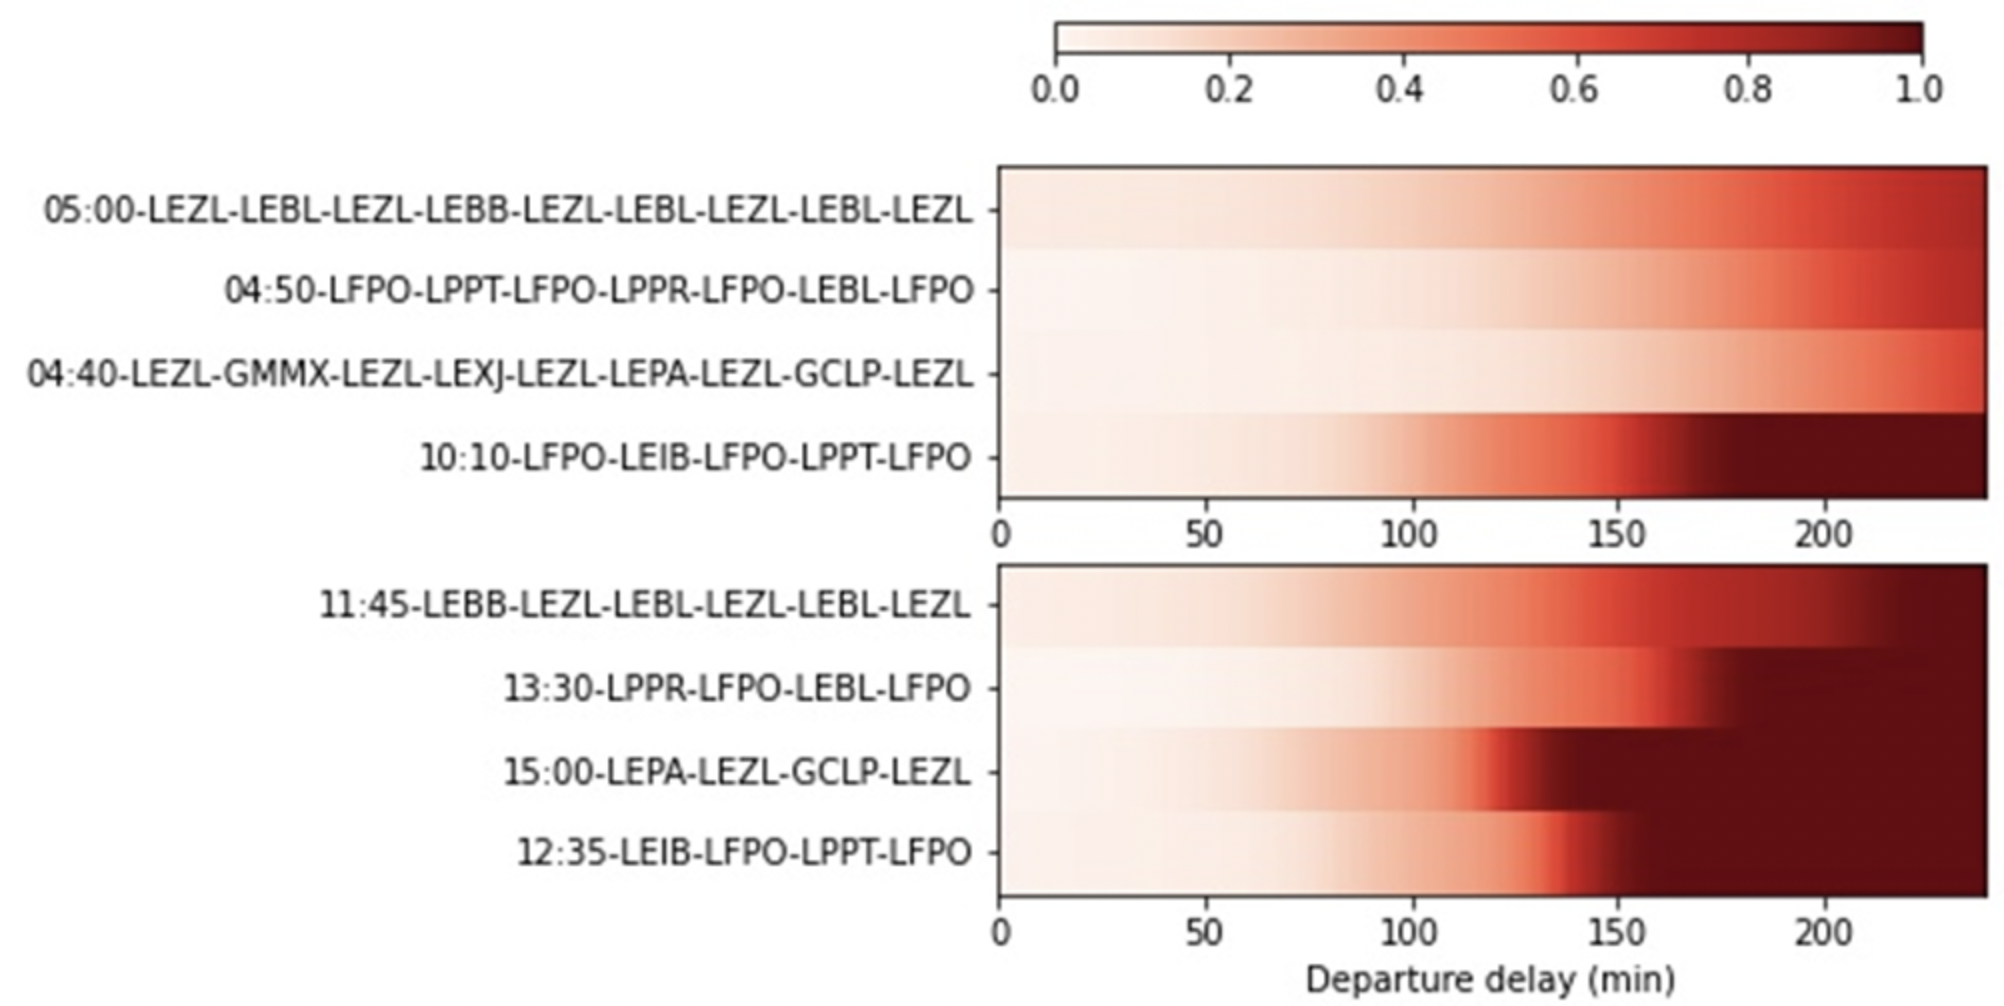
Figure 5: Bar plot showing the probability of infringing the curfew at the final airport of a flight sequence. In the text are shown the airport ICAO codes and scheduled departing time of the first flight (e.g. 12:35 – LEIB – LFPO – LPPT – LFPO). The probabilities are computed as a function of the departure delay of the first flight in the sequence.