Pilot3 Optimisation Architecture

Author: Jovana Kuljanin (UPC)
Pilot3 could be triggered at some point of the departure procedure or when the aircraft is already en-route. The system will optimise the aircraft trajectory from the current aircraft state (i.e., the moment Pilot3 is triggered) down to reaching FL100 at the proximity of the destination. After consultation with the Advisory Board, it is understood and assumed that from that altitude to the runway, the actions of the pilot are limited and standardised. Therefore, the trajectory plan will be computed assuming standard operations for this final segment (from FL100 to the runway) of the flight (i.e., a fixed sequence of aircraft intents) but dynamically estimating how long these procedure would be.
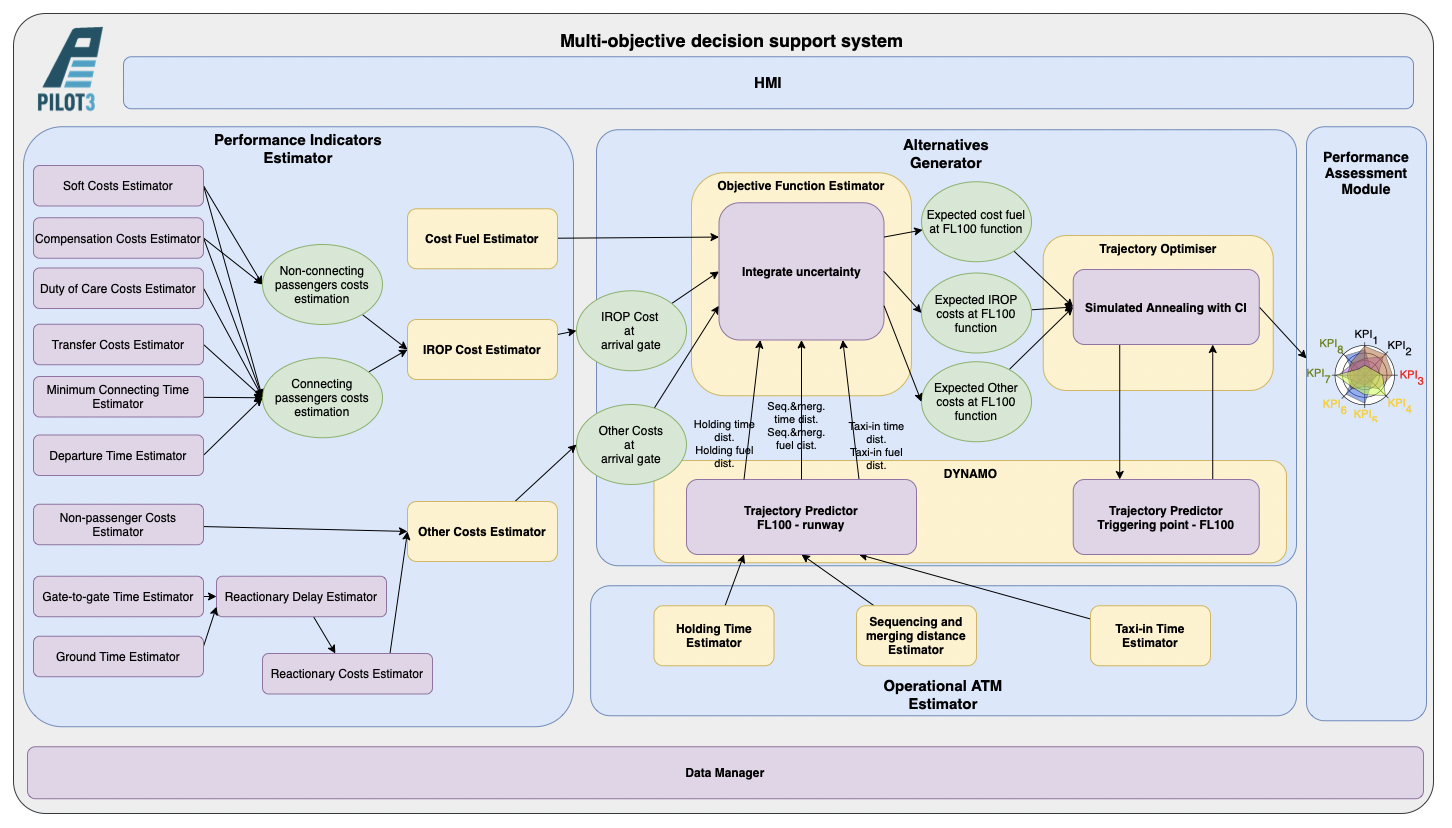
Figure 1. High-level block diagram of Pilot3 architecture modules and functional relationship between them.
Among several different components of Pilot3 (see Figure above), the alternatives generator is in charge of the optimisation of the trajectory from the triggering point to FL100. It is composed of different elements:
- Objective function estimator, which uses the outcome of the performance indicator estimator, which estimates the cost of delay as a function of arrival time at the gate, and of the operational ATM estimator, which estimates uncertainties at arrival (holding, distance of the sequencing and merging procedure and taxi-in time). The objective function estimator integrates these uncertainties in the cost function and translate this cost function into expected costs as a function of the arrival time at FL100.
- DYNAMO trajectory predictors, which are used to estimate the fuel and time from FL100 to the runway to translate the uncertainty in distance from the operational ATM estimator into uncertainty on time and fuel; and to optimise the trajectory given a Cost Index to be used by the trajectory optimiser.
- Trajectory optimiser, which using an optimisation algorithm finds the best cost index to minimise the expected cost. It is assumed that a given cost index produces a vertical profile and Pilot3 will find the cost index which minimised the total expected cost.
The cost function can be seen as a step-wise function, as increments are produced linked to events, e.g. passenger missing connections, reaching the curfew for having to compensate passengers due to Regulation 261, or breaching a curfew at the end of the day due to reactionary delay. However, most of these parameters have some degree of uncertainty (e.g. if passengers will miss their connection does not only depend on the arrival time of the flight but also on the actual time taken by passengers to do the connection at the airport and on the status of the remaining flights in the fleet). The expected cost function considering all these internal uncertainties is computed by the performance indicator estimator with respect to the arrival time at the gate and is represented in Figure 2.
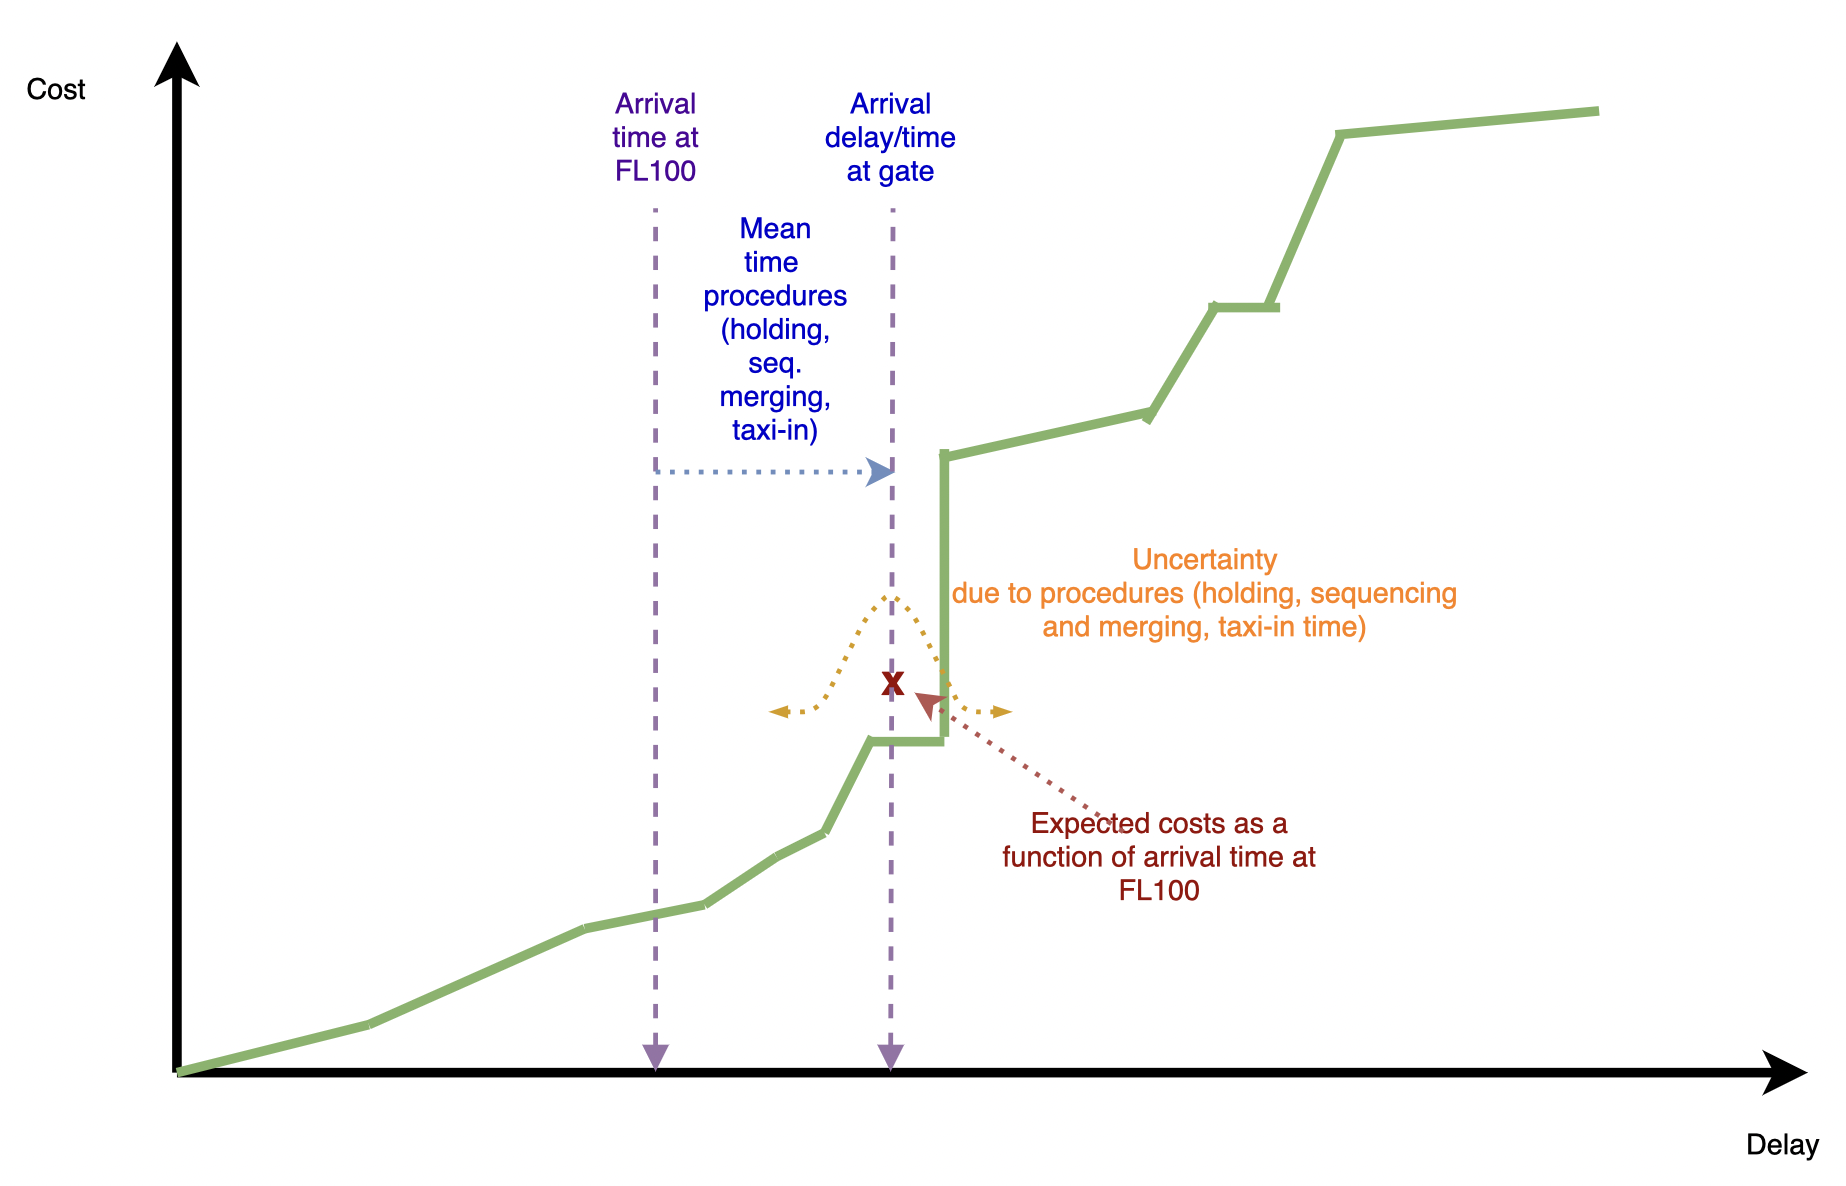
Figure 2. Propagation of uncertainty as a function of the arrival time in the total cost function.
As shown in Figure 2, given an arrival time to FL100, the actual time of arrival at the gate will be in average that time plus the expected time at holding, the expected time of sequencing and merging and the expected taxi-in time. If all the distributions are considered, their stochastic processes will be added, i.e., convolved. Then as presented in Figure 3, the expected cost can be computed as a function of the arrival time at FL100. This cost functions now integrates the uncertainty on the time required to reach from FL100 to the gate.
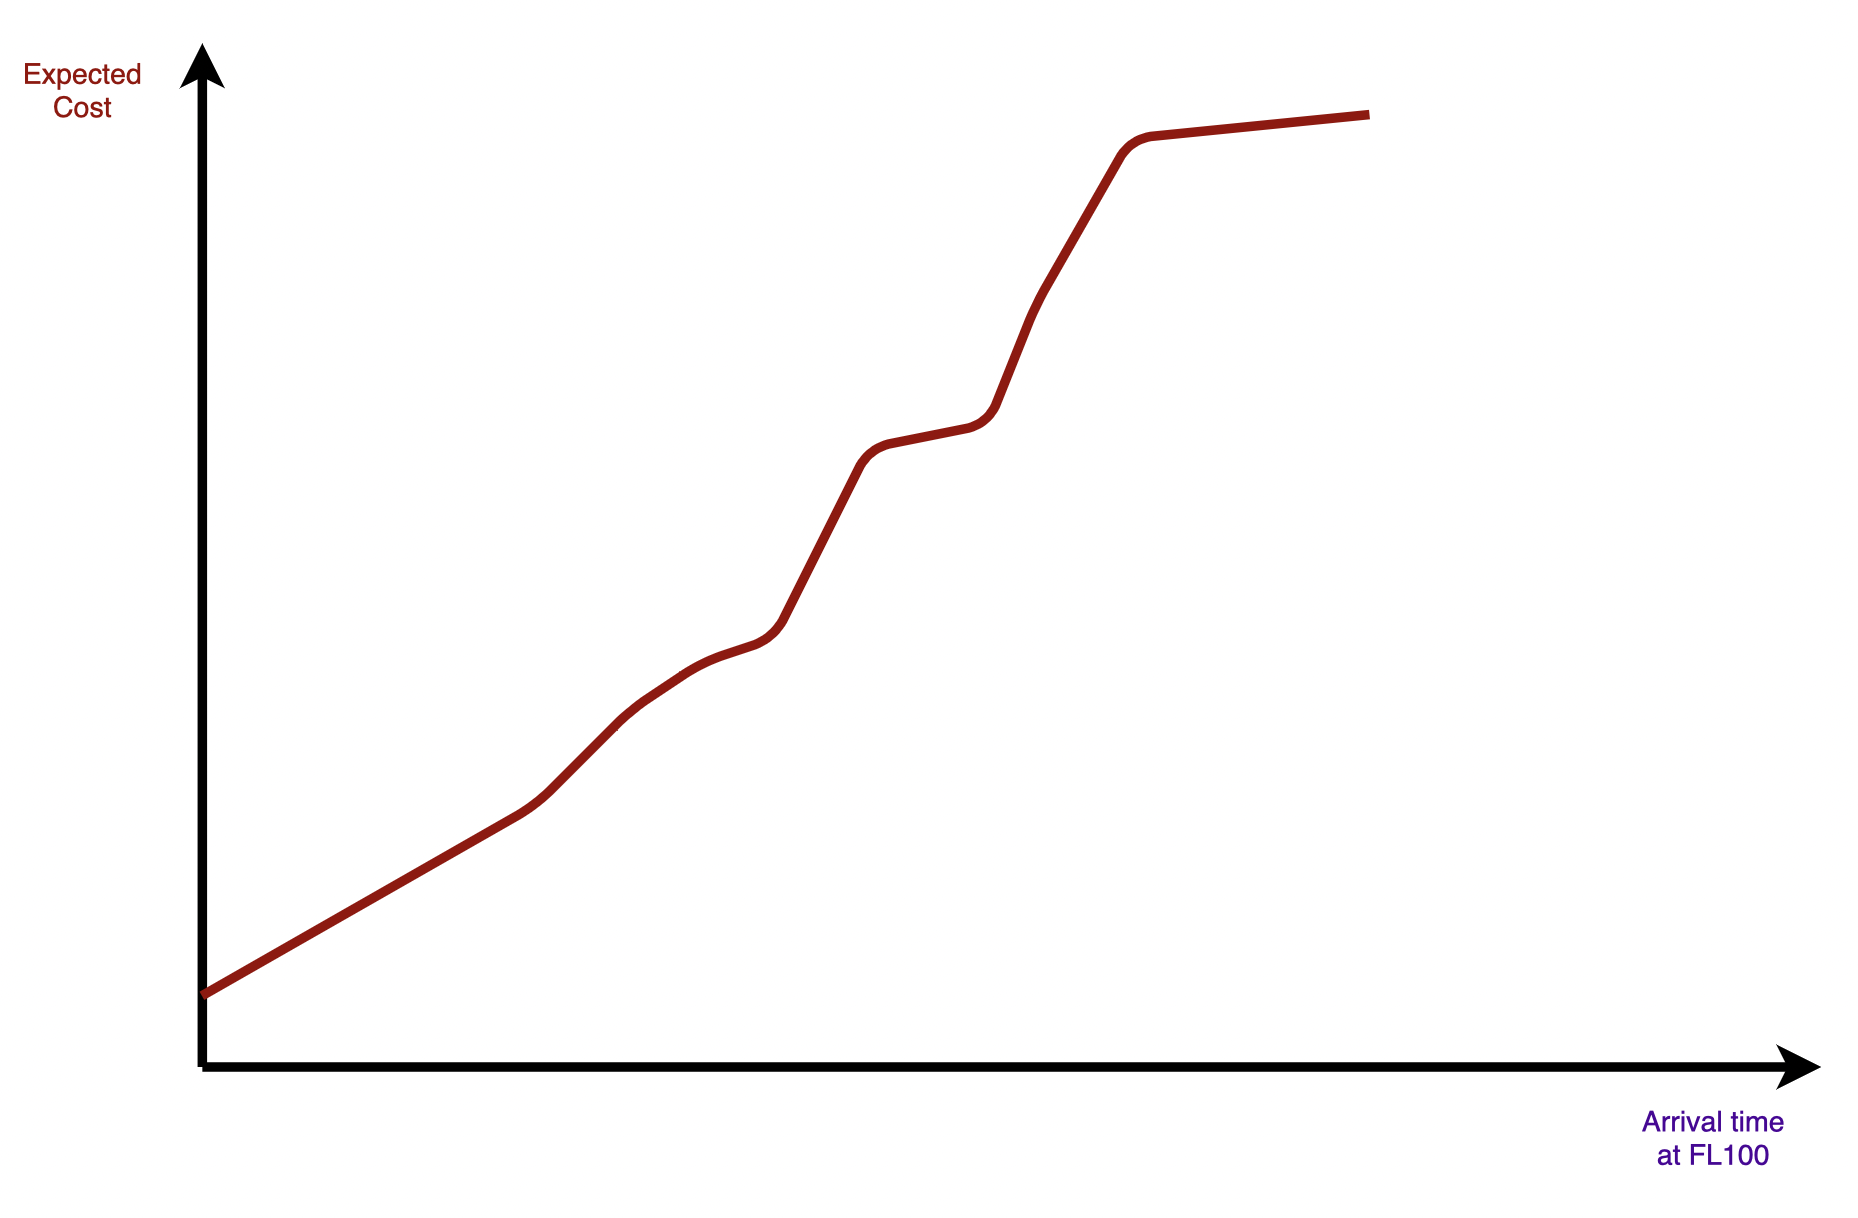
Figure 3. Total expected cost (considering all the uncertainty components) as a function of the arrival time at FL100.
Finally, the trajectory optimisation module aims to find the best vertical flight profile between the trigger point of Pilot3 and FL100 by selecting the optimal cost index. Note that, because the trajectory predictor is used internally to produce flyable phases of cruise and descent, the produced trajectory is deterministic (all the uncertainties are modelled from FL100 onwards).
The current approach uses a two-step optimisation approach:
- DYNAMO given a cost index as a control variable selects the set of flight altitudes and speeds that minimise a direct operating cost type function (DOC-type) (cost = fuel + CI * time). This generates the vertical profile from triggering point up to reaching FL100 in the descent towards the arrival airport. The output of this step is the estimated fuel consumption and the arrival time at FL100. Figure 4 shows the fuel, time and total DOC-type cost for several values of CI explored.
- The Trajectory Optimiser of Pilot3 successively uses the DYNAMO optimiser with different values of the CI as input. In this case, a Simulated Annealing heuristic optimiser is used to explore and find the best value of CI in order to minimise the (true) total expected cost, which is now provided by the objective function estimator module of Pilot3.
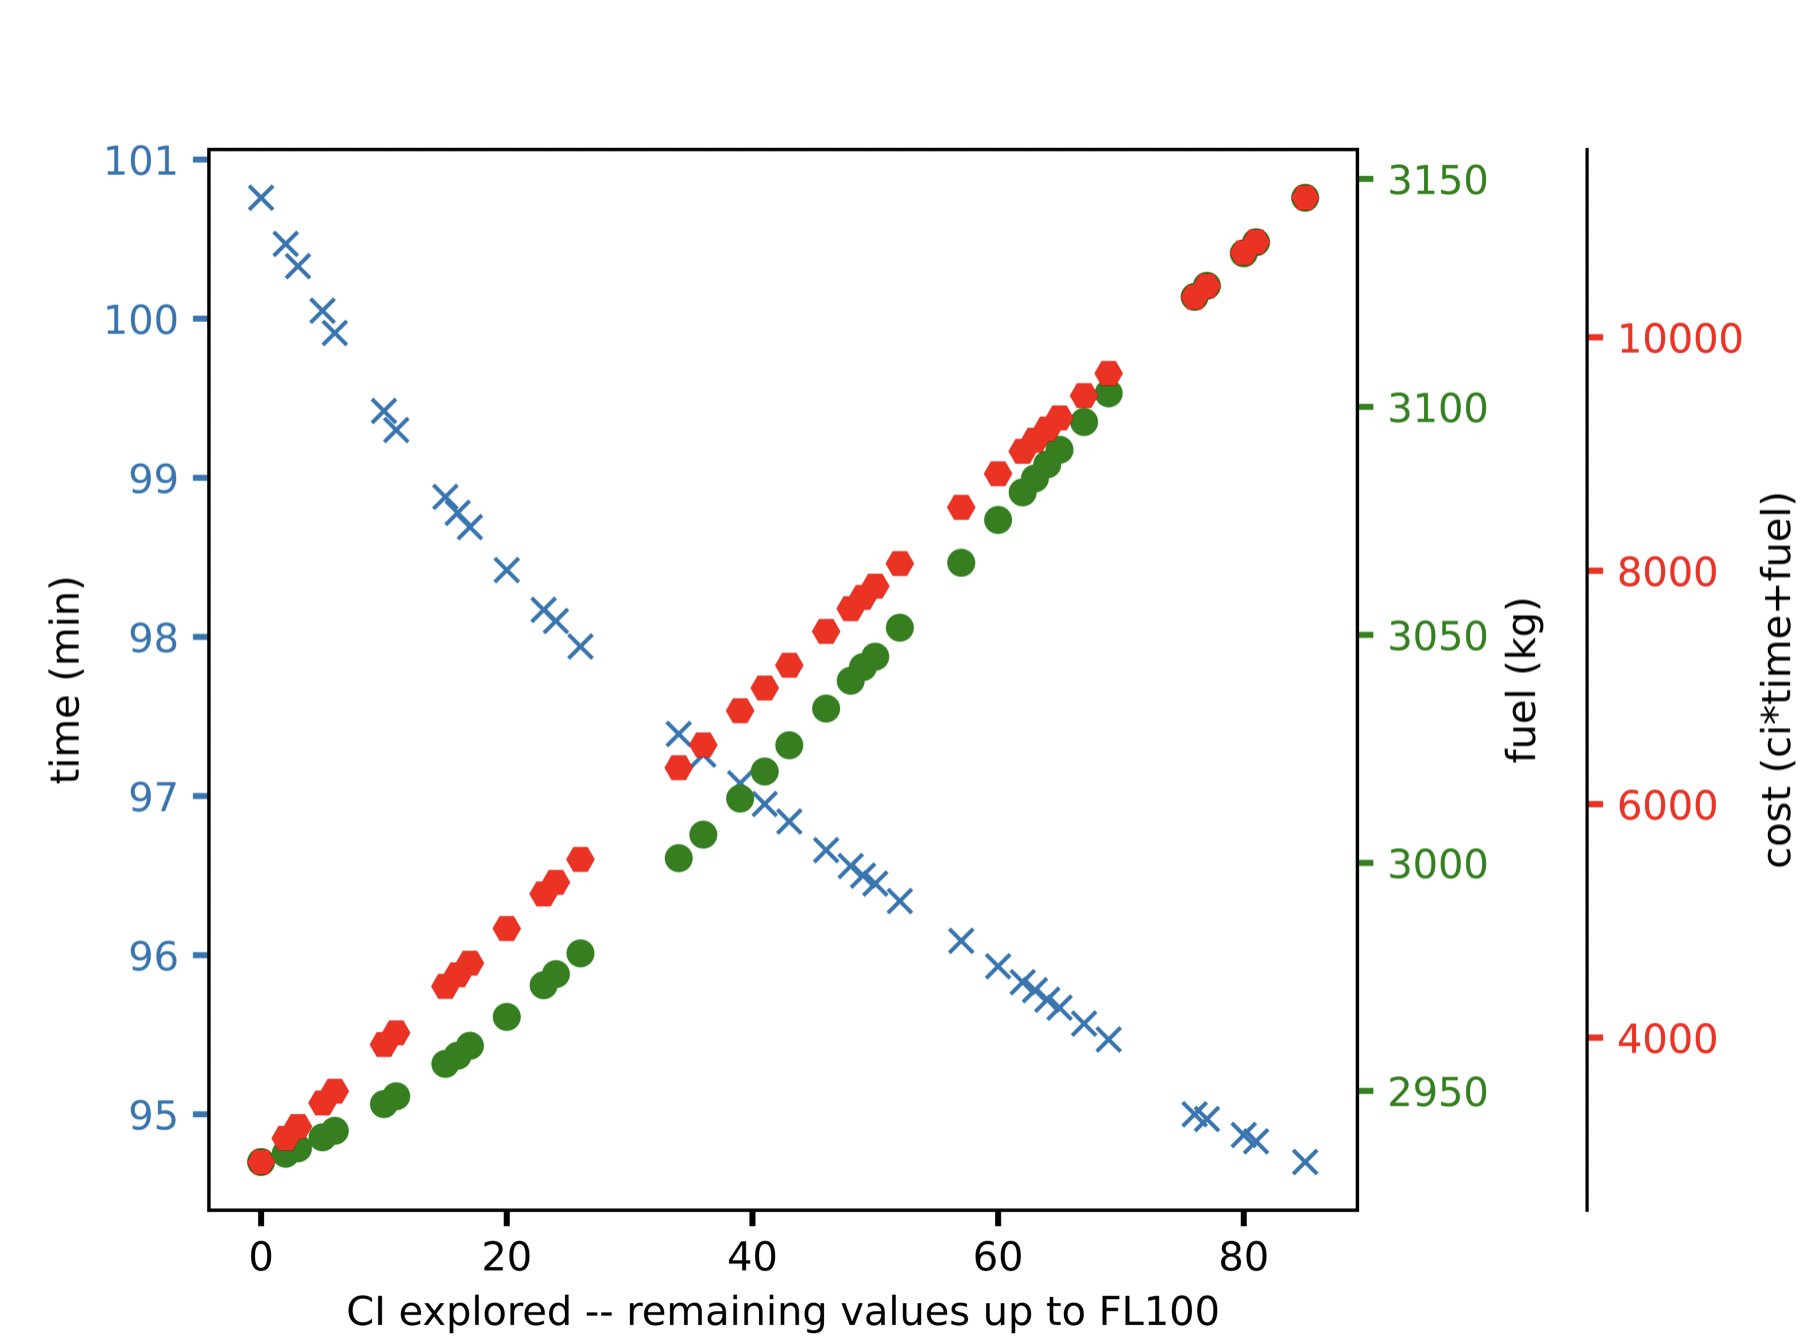
Figure 4. Resulting fuel mass (green dots) and flight time (blue crosses) returned by DYNAMO, as a function of the value of CI. The total cost according to a DOC function is also represented (red dots).
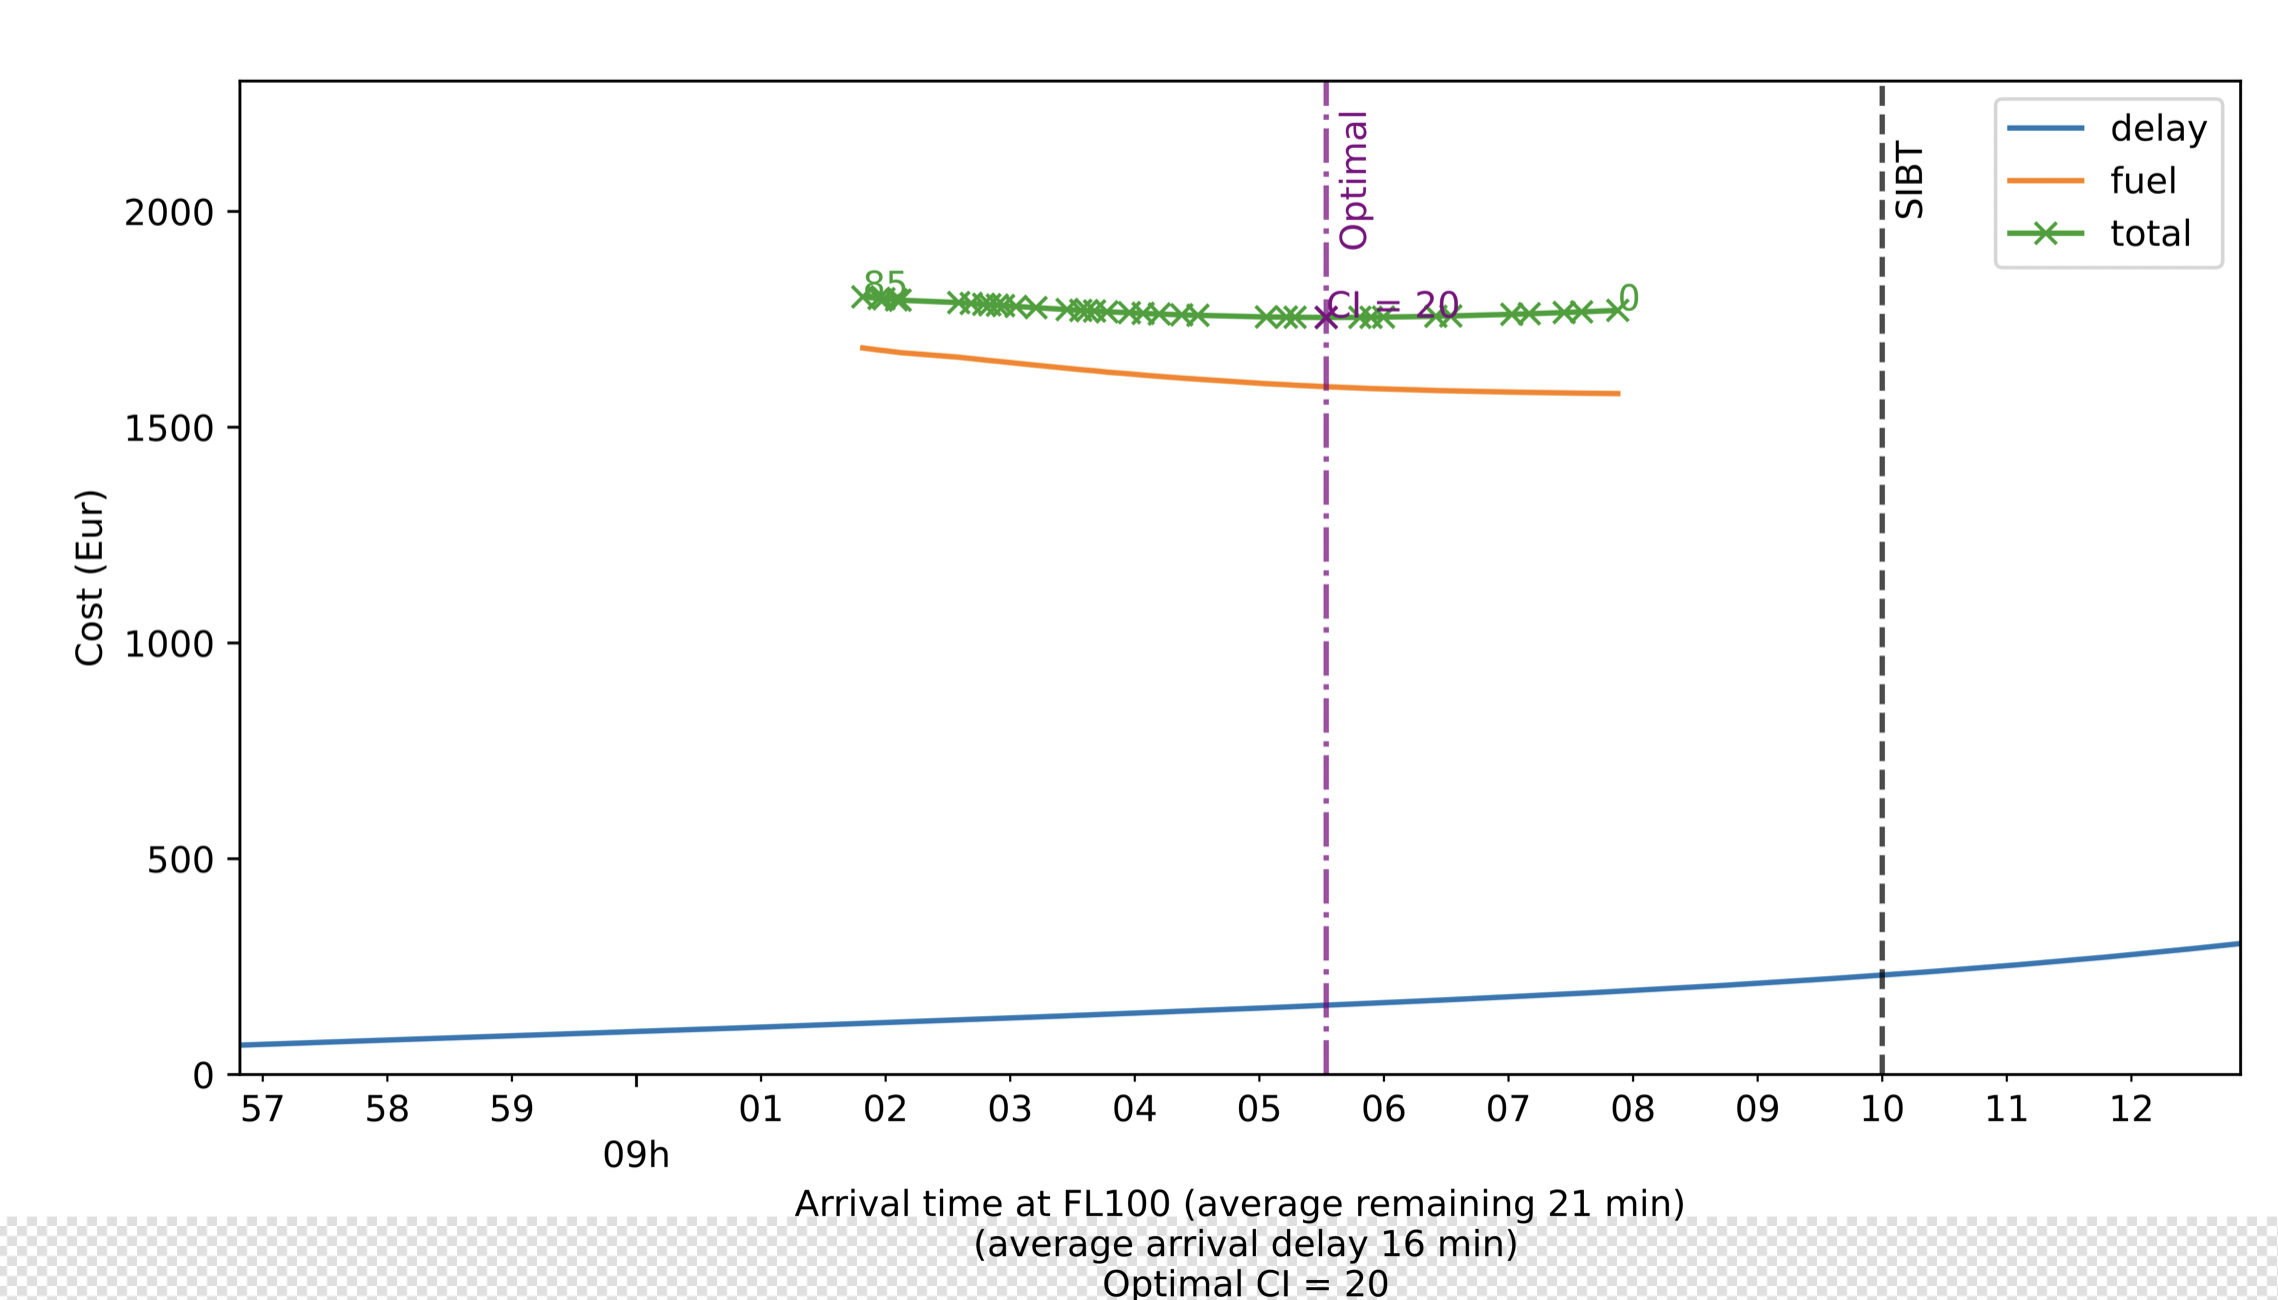
Figure 5. Total cost function, including uncertainty (blue line) and the cost of fuel (orange line) returned by DYNAMO for several values of CI (crosses) explored during the simulated annealing optimisation process. The total cost is also included (green line).
In the current implementation of Pilot3, the optimisation framework only provides with a single alternative (trajectory) based on an optimal cost index. In future development, instead of using the cost index as a proxy to optimise the vertical profile, the altitude and speed will be optimised directly considering the cost function provided by the objective function generator increasing the space of search beyond the reachable just modifying the cost index.