Estimating operational uncertainty in Pilot3

Author: Clara Argerich (Innaxis)
Operational estimators that shed light on arrivals
Pilot3 software is a tool that optimizes trajectories based on factors that affect flight performance—everything from possible network disruptions, to bad weather and so on. For the purposes of this post, we will focus on how Pilot3 specifically helps shed light on operational uncertainty at arrival. When nearing its destination, an aircraft may face different scenarios that change its flight path. For instance, if an aircraft approaches a very crowded terminal manoeuvring area (TMA), it may be sent to a holding circuit—an event that will increase its flying time, fuel usage and punctuality.
Various indicators are derived from the operational environment and must be taken into account in order to estimate the punctuality of a flight. Punctuality is measured in relation to arrival at the destination gate; most of the costs that will be incurred tactically (i.e. once the flight is in operation) are related to the arrival time at the gate. Therefore, not only should the time taken to reach the TMA be taken into account, but the time taken to reach the arrival gate, as well. The way an aircraft approaches the TMA and the time spent inside the TMA affects the total flight time (and thus the fuel required), sequencing and merging procedures. Some of the operational indicators of air traffic management (Figure1) most relevant to time are:
- Distance travelled in terminal airspace due to arrival sequencing and merging from FL100. Distance is directly related to time, so an aircraft flying a longer distance from FL100 to the runway will be in the air for longer.
- Holding time in terminal airspace. As previously stated, an aircraft in holding will spend more time in the TMA
- Taxi time on arrival. The time an aircraft spends taxiing is key in ground traffic management; runway orientation airport size may have a great impact on this feature.
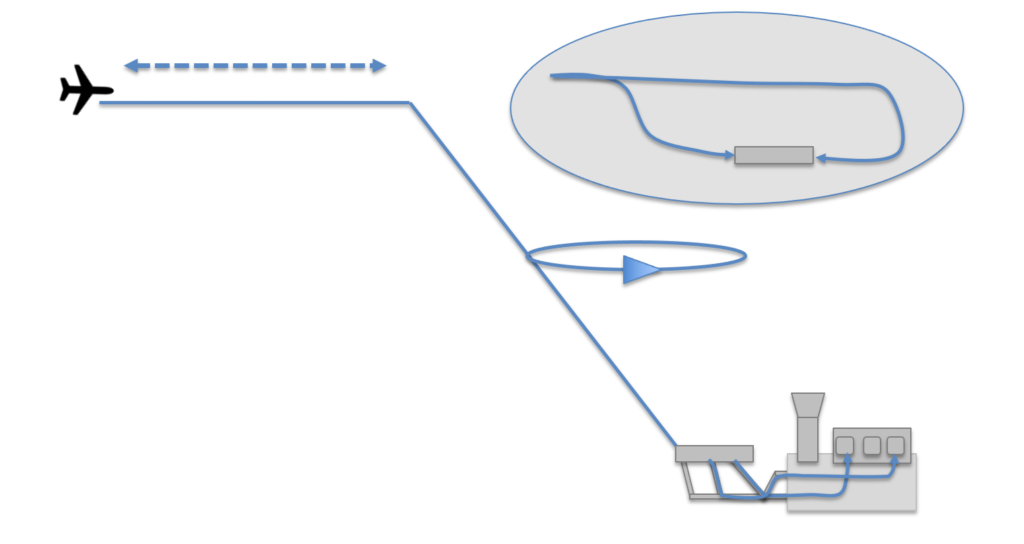
Figure 1:Operational Uncertainty at Arrival
Relevance of uncertainty at arrival
So, what about uncertainty at arrival? Estimating taxiing time or holding time may not adequately capture uncertainty as these estimations are still associated to error and may not be representative of a given scenario. For instance, an aircraft flying under perfect weather conditions and average traffic in the TMA will most likely have an average arrival distance. On the other hand, an aircraft approaching an airport with rare traffic conditions and bad weather is more likely to present higher uncertainty. In that case, the estimator will have a high standard deviation and the probability of having different values could be higher. Figure2 represents this example with two curves: the blue curve represents low uncertainty, as there is a 50% probability of flying 40 NM; the orange curve represents high uncertainty, where an aircraft may have to fly from 30 to 50 NM.
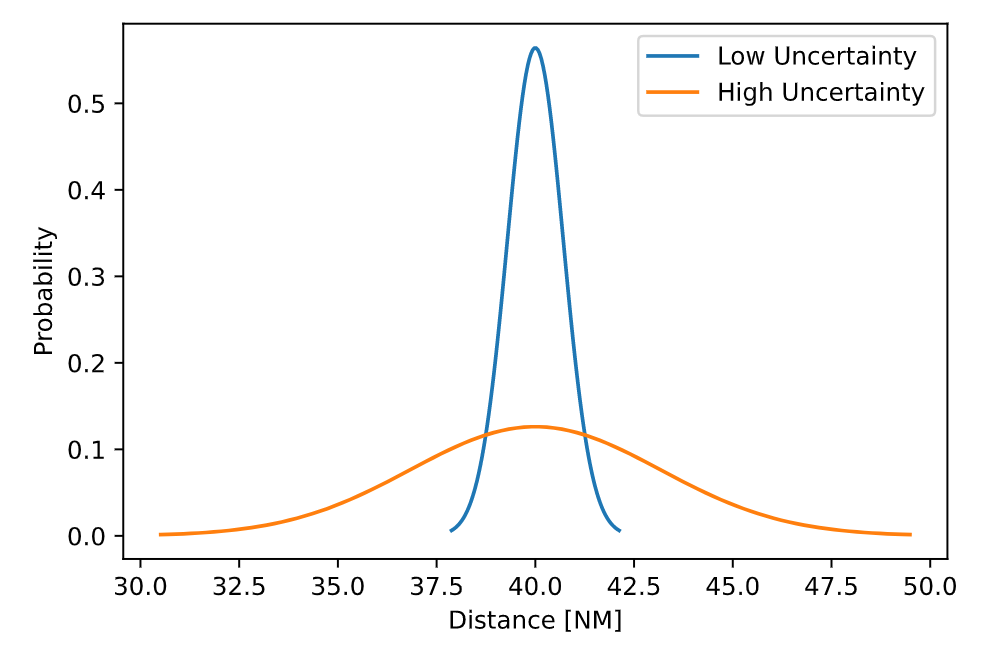
Figure 2: High vs. low uncertainty on estimators
How to evaluate uncertainty
These parameters, also called operational ATM estimators, and their associated uncertainty can be estimated using two, data-driven approaches. The first approach is based on heuristic estimators extracted from real radar data or other sources; the second approach is based on machine learning techniques. Both approaches provide the same type of output: a probability distribution of the expected value for the estimator. The purpose of this probability distribution is to include the uncertainty associated with each estimator. Through this methodology, Pilot3 software can calculate the probability of having a taxi time, rather than calculating a specific taxi time. In the case of heuristic estimators, this probability distribution is associated with the landing airport, and therefore the computational cost of the estimators is very low.
Going back to specific examples within Pilot3, one could model the uncertainty at arrival by extracting all arrival distances from a dataset (Figure 3) and calculating their probability (Figure4).
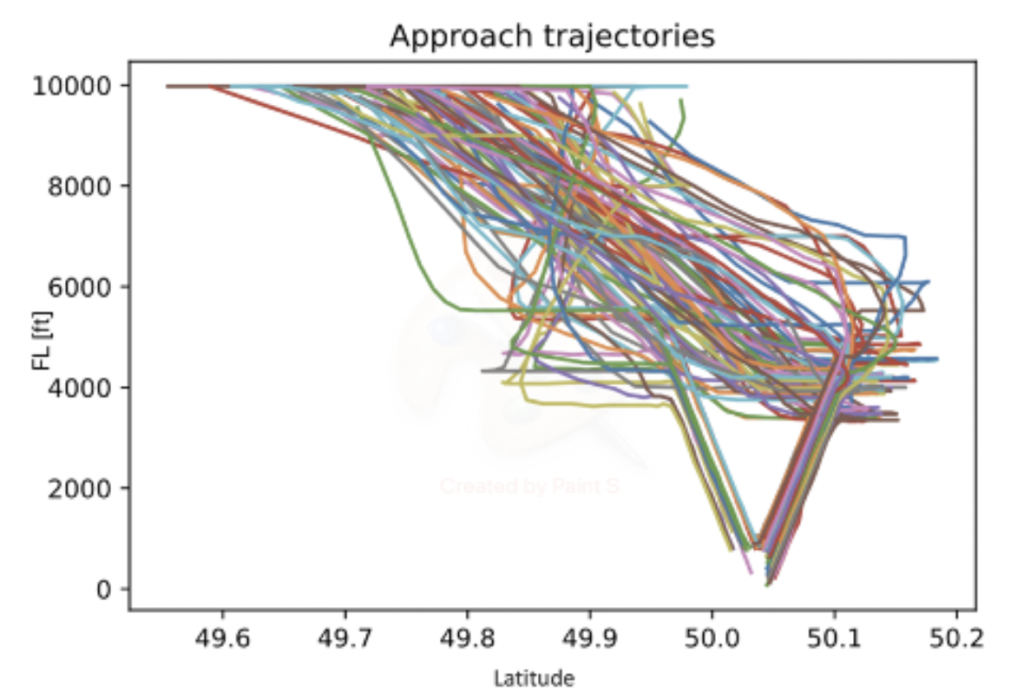
Figure 3: Approach trajectories within a TMA
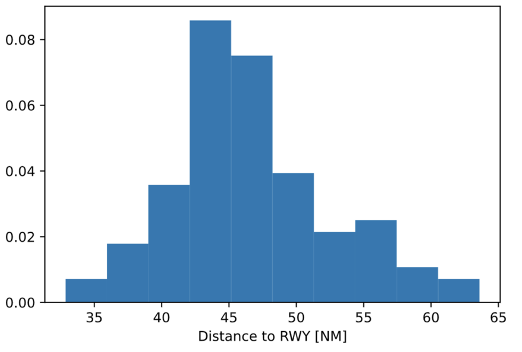
Figure 4: Uncertainty of real approach trajectories
This output can also be obtained by means of machine learning techniques, in which more features are considered, such as weather at the arrival airport, aircraft type, etc. Machine learning techniques are used for predicting the expected value for these estimators given specifics related to aircraft, performance, and conditions. In order to assess the uncertainty of this prediction, another machine learning model is then used to compute the probability of prediction error with a given set of values. With estimators based on machine learning, the output is unique for each flight, as the machine learning model runs every time Pilot3 is triggered for a selected aircraft or when data is updated. Once the estimators are predicted, the impact of the uncertainties on total cost is computed. Overall, the output is also visualized as a probability distribution, which takes into account the prediction uncertainty for the selected operational ATM estimator. This probability distribution is then fed to the Alternatives Generator in Pilot3 in order to integrate these uncertainties into the costs so that the expected cost at arrival can be estimated.