On maps

How are “mobility” and trips visualized and represented? Well, the most direct, intuitive way of doing so, is using maps. Representations, converting the 3-dimensional earth (*sphere*) to a flat 2-dimensional surface. This post is about maps, map properties, map distortion and curious maps. We hope you enjoy it!
Mapping the earth, or parts of it, is a classic, well-studied problem. For hundreds / thousands of years, cartographers and mathematicians have come up with different methods to map the curved surface of the earth to a flat plane. The main problem is that you cannot do this perfectly, (Theorema Egregium). The shape, area, distances and directions of the surface cannot be represented properly at the same time on a map.
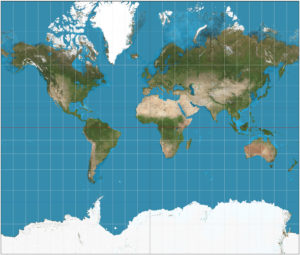
Shape: If a map preserves shape, then feature outlines (like country boundaries or the coast lines) look the same on the map as they do on the earth. A map that preserves shape is conformal. The amount of distortion, however, is regular along some lines in the map. For example, features lying on the 20th parallel are equally distorted, features on the 40th parallel are equally distorted (but differently from those on the 20th parallel), and so on. The Mercator projection is one of the most famous and well-used shape-preserving maps:
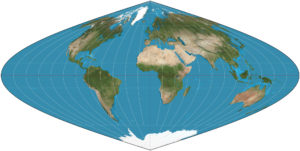
Area: If a map preserves area, then the size of a feature on a map is the same relative to its size on the earth. For example, on an equal-area world map, Spain takes up the same percentage of map space that the actual Spain takes up on the earth. In an equal-area map, the shapes of most features are distorted. No map can preserve both shape and area for the whole world, although some come close over sizeable regions. Sinusoidal projection is an area-preserving projection:
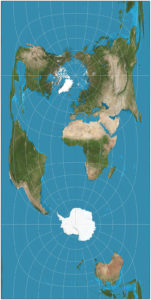
Distance: If a line from a to b on a map is the same distance (accounting for scale) that it is on the earth, then the map line has true scale. No map has true scale everywhere, but most maps have at least one or two lines of true scale. For instance, in the Casini projection, the distances perpendicular to central meridian are preserved:
Direction: Direction, or azimuth, is measured in degrees of angle from north. On the earth, this means that the direction from a to b is the angle between the meridian on which a lies and the great circle arc connecting a to b. If the azimuth value from a to b is the same on a map as on the earth, then the map preserves direction from a to b. No map has true direction everywhere.
Finding the compromise: Most of the maps used are compromise solutions, partially preserving some of the above mentioned properties. The most used one (by far) is the one you can find in Google Maps, OpenStreetMaps etc. called Web Mercator, Google Web Mercator, WGS 84 Web Mercator or WGS 84/Pseudo-Mercator. It is a variation of the Mercator projection, ignoring the ellipticity of Earth for faster computation: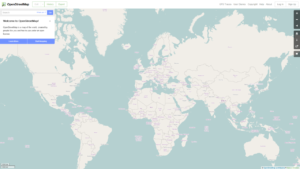
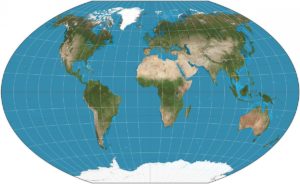
The Winkel tripel projection. “Triple” stands for trying to minimize errors in three properties at the same time: area, direction, and distance. The Winkel tripel is the arithmetic mean of different projections (equi-rectangular, area and shape preserving)
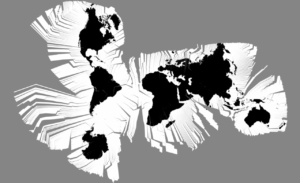
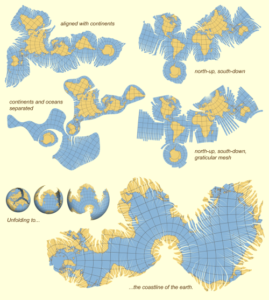
There is even a whole family called Myriahedral projections. These consider the earth *sphere* to be a polyhedron with a very large number of faces, a “myriahedron”. This myriahedron is cut open into small pieces and unfolded. The resulting maps have a large number of subareas that are (almost) conformal and that (almost) conserve areas. The location of the map interruptions can be “selected” (oftenly using sea areas etc)
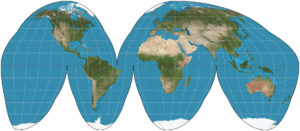
Some ingenious representations mix the approach from Myriahedral projections and other property-preserving projections. e.g. the Goode Homolosineprojection:
All the previous projections provoke distorsion. There is no perfect projection. In the nineteenth century, Nicolas Auguste Tissot developed a simple method for analysing map-projection distortion. An infinitely small circle on the earth’s surface will be projected as an infinitely small ellipse on any given map projection. The resulting ellipse of distortion, or “indicatrix”, shows the amount and type of distortion at the location of the ellipse. Some examples for the most-used projections are given below.
If all the previous was not enough, it just leaves the door open to other projections that represent additional variables in maps, such as socio-demographic or technical indicators.
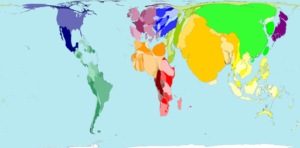
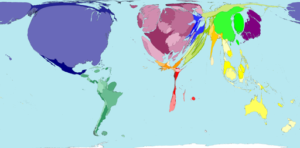
A map with country size proportional to population:
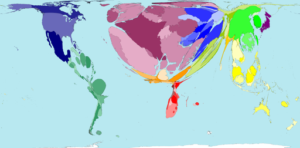
Proportional to number of immigrants:
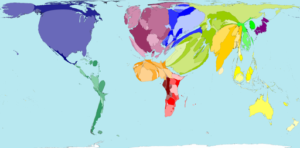
Proportional to the number of tourists (Spain the biggest country in the world!):
Or even proportional to the total number of flights (this is one of my favourites!):
Some references and further reading on the topic:
- http://www.citymetric.com/horizons/true-size-map-lets-you-move-countries-around-globe-show-how-big-they-really-are-1380
- https://www.win.tue.nl/~vanwijk/myriahedral/
- https://en.wikipedia.org/wiki/Theorema_Egregium
- https://en.wikipedia.org/wiki/List_of_map_projections
- http://www.businessinsider.com/mercator-projection-v-gall-peters-projection-2013-12
- http://www.worldmapper.org/